August 25, 20264 min read
Designing Looker Studio Dashboards That Drive Action
Looker StudioGA4Business IntelligenceDashboards
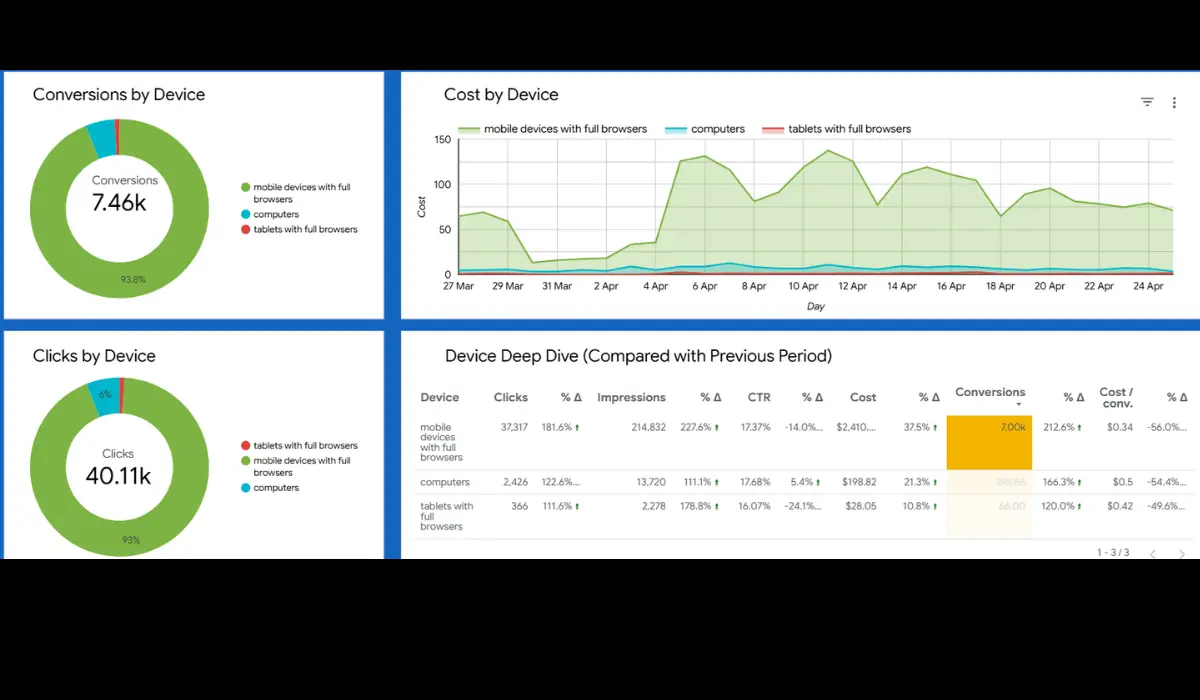
Many analytics dashboards end up as unused charts. The problem isn't the data — it's the structure.
The Rule of 3 Dashboard Hierarchy
1. **Executive Overview**: High-level ROAS, revenue, CPA, and MoM growth. 2. **Channel Performance**: Breakdown by Google Ads, Meta Ads, Organic, and Email. 3. **Diagnostic Funnel**: Micro-conversions, drop-off rates, and page performance.
Best Practices in Looker Studio
- **Color Discipline**: Use accent colors only for key metrics and alerts. - **Blended Data**: Connect GA4 and Google Ads carefully on date & campaign IDs. - **Automated Refresh**: Keep stakeholders looking at live performance data.